

Performance and project options
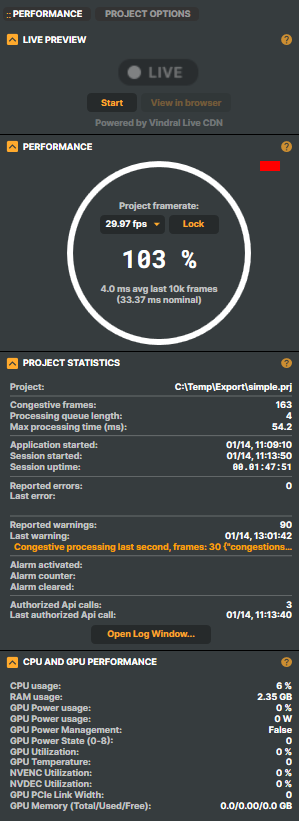
Composer Desktop's Performance & Options panel sits on the right of the Scene view window and exposes performance metrics plus per-project settings that affect how the project runs (in both Desktop and the headless Composer Runtime). The same project-level settings apply when the project is loaded by a Runtime instance — the panel is just the Desktop UI for editing them.
The panel is split into two tabs at the top:
- Performance — live, read-only metrics: processing time, congestion counters, error / warning history, alarm status, and host CPU / GPU load.
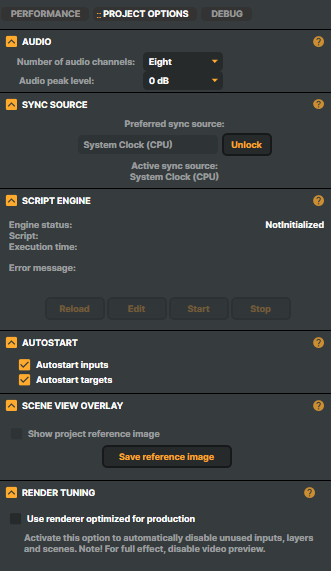
- Project options — editable, per-project behaviour: audio channels, sync source, script engine, autostart, scene overlay, and render tuning.
Every section inside both tabs is a collapsible expander, and each section's expand / collapse state is remembered between sessions. Project Options values are persisted into the .prj project file, so once a project is configured the same behaviour applies wherever the project is loaded — Desktop today, Composer Runtime tomorrow.
The most important number here, from a performance perspective, is the processing time. Aim to keep it below 80–90 % of the nominal frame budget; sustained values above that mean Composer is one packet-loss or encoder-burp away from a dropped frame.
Performance tab
The Performance tab is divided into four collapsible sections — Live preview, Performance (the live gauge), Project statistics, and CPU and GPU performance — described below.
Tip — debug-only properties
Some rows in the Performance tab are only shown when Settings → Debug → Show debug properties is ticked. These are flagged (debug) below. They surface additional internal metrics and counters that aren't needed for day-to-day operation — leave the toggle off in production.
Live preview
Composer can publish a low-overhead live preview of the active scene through the Vindral CDN, so stakeholders, customers, or colleagues can watch the show without any RTMP / SRT setup of their own. Up to 10 simultaneous viewers are supported. For broader broadcast, use the dedicated streaming targets (RTMP Target, SRT Target) or contact RealSprint about an unlimited Vindral channel.
- Start / Stop — starts or stops the live preview renderer.
- View in browser — opens the published preview in the default web browser. Enabled only once the preview is running.
- Preview thumbnail — clicking the on-air thumbnail also opens the preview in the browser.
Live preview requires:
- Live Preview enabled under Settings.
- A valid production or evaluation licence (it's not available in trial mode).
- Render Tuning disabled (see below — the two features are incompatible).
Performance (live gauge)
The large circular indicator at the top of the tab is the most important number on the panel.
| Property / control | Description |
|---|---|
| Project framerate | The project's video frame rate, with a Lock / Unlock button. The dropdown is editable only when unlocked. Locking is the default and recommended state. |
| Processing time percentage | The headline number inside the ring (e.g. 42 %), expressed against the nominal frame budget. |
| Average processing time | Beneath the ring, formatted as X.X ms avg last 10k frames. |
| Nominal frame budget | Also beneath the ring, formatted as (X.XX ms nominal) — the time available per frame at the current frame rate. |
| Playback state overlay | When the project is not running, the ring shows (STARTING), (STOPPING), (STOPPED), or (PAUSED) instead of the percentage. |
| Congestion indicator | A small red rectangle in the section's top-right corner appears when Composer is unable to keep up and frames are being congested. |
Note — frame-rate changes
Unlocking and changing the project's frame rate restarts every RTMP, NDI, and Decklink target. Avoid mid-show. For Decklink targets the available Display mode options are also filtered by project frame rate, and the dropdown only refreshes when the frame rate is re-locked — see Blackmagic Decklink Target v4 for details.
Project statistics
Lifetime counters and session metadata. All values here are read-only.
| Property / control | Description |
|---|---|
| Project | Currently loaded project file (short name). Hover for the full path. A yellow * next to the name means the file (or its version) was changed outside Composer since it was loaded. |
| Congestive frames | Count of frames where Composer had to re-prioritise rendering due to load. |
| Processing queue length | Should stay at 0. Any sustained non-zero value means the host is being asked to do more than it can keep up with. |
| Max processing time (ms) | Peak processing time observed during the session. Useful for headroom analysis. |
| # skipped frames | Only visible when Skip render frame on high compute time is enabled in Settings. Counts frames dropped under that policy. |
| Input audio processing (ms) (debug) | Average time spent in input audio processing. |
| Input audio wall clock (ms) (debug) | Wall-clock time for the same. |
| Worker queue flushes (debug) | Internal worker queue flush counter. |
| Application started / Session started / Session uptime | For log-trail context. Uptime is shown as dd.hh:mm:ss. |
| Reported errors | Count, plus Last error (timestamp + message in red). |
| Reported warnings | Count, plus Last warning (timestamp + message in orange). |
| Alarm activated / Alarm counter | When an alarm is currently active, shows when it triggered and how many times it has triggered this session. |
| Alarm cleared | Timestamp of the most recent alarm clear (hidden until at least one clear has happened). |
| ALARM ACTIVE button | A large red button appears while an alarm is active; click it to clear the alarm. |
| Authorized API calls | Total authorised HTTP API calls processed. |
| Last authorized API call | Short summary of the most recent call. |
| Open Log Window... button | Opens the in-app log window for the current session. |
Tip — clearing errors and warnings
Right-click on a warning or error row and choose Clear errors and warnings to reset the displayed counts. The underlying log entries stay on disk; this only resets the UI counter.
WebSocket metrics (debug only)
A WebSocket metrics block appears at the bottom of Project statistics when Settings → Debug → Show debug properties is ticked. The block is hidden in normal operation. The same numbers are exposed to Prometheus via the Composer Monitor for production observability — the in-app block is the quick-look equivalent.
| Property / control | Description |
|---|---|
| WebSocket clients | Number of WebSocket clients currently connected to the project. |
| WebSocket egress msg/s | Outgoing message rate, messages per second. |
| WebSocket egress | Outgoing bandwidth, KB/s (instantaneous). |
| WebSocket egress avg | Outgoing bandwidth, KB/s averaged over the session. |
| WebSocket ingest avg | Incoming bandwidth, KB/s averaged over the session. |
| WebSocket incoming messages | Total incoming messages since the session started. |
| WebSocket outgoing messages | Total outgoing messages since the session started. |
CPU and GPU performance
Live host metrics for the machine Composer is running on.
| Property / control | Description |
|---|---|
| CPU usage | Sustained > 80 % means the host is over-committed. |
| RAM usage | Memory leaks creep up over hours; tracking the trend matters more than the instantaneous value. Hidden when the value reads 0. |
| GPU Power usage | Reported both as a percentage of the card's TDP and in watts. |
| GPU Power Management | Whether the driver's power management is engaged. |
| GPU Power State (0-8) | Power-state variation under load is a tell that GPU clocks aren't locked. See Tuning for maximum performance. |
| GPU Utilization | The GPU's compute occupancy. |
| GPU Temperature | NVIDIA GPUs throttle from around 83 °C; sustained operation above that ceiling means the cooling is undersized. |
| NVENC Utilization / NVDEC Utilization | The hardware encoder / decoder load, independent from GPU compute. Hidden on cards without NVENC/NVDEC support. |
| GPU PCIe Link Width | Should be x16; narrower means a slot is electrically narrow or a riser cable is bad. |
| GPU Memory | VRAM Total / Used / Free in GB. Out-of-memory crashes are a common production failure mode. |
| Create Performance Report button | Captures a one-off diagnostic snapshot at the bottom of the section. For details and how to interpret the output, see Performance Report in Operations. |
Project options
Project Options live next to the Performance tab and define how the project itself behaves:
Audio
| Property / control | Description |
|---|---|
| Channels | Stereo (default) or Eight channels. Eight-channel mode unlocks the channel-strip MAPPING tab and per-channel VU meters in the Channel strip inspector. |
| Peak level | 0 dB to +18 dB, default 0 dB. Sets the maximum level displayed in audio meters across the UI. |
Sync source
The default sync source is the system clock (CPU). For camera setups where Composer needs to be tightly synchronised with an external genlock or camera reference signal, the sync source can be switched to a specific input. Most frame-skip issues are caused by host overload, not sync drift — start by checking Performance and optimization before assuming a sync problem.
| Property / control | Description |
|---|---|
| Preferred sync source | Dropdown of available sources, editable when unlocked. |
| Lock / Unlock button | Locks the chosen source so it can't be changed by accident during a show. Locked is the recommended state for production. |
| Active sync source | Display-only line showing the source Composer is currently driven by (this may differ briefly from Preferred while a switch is taking effect). |
Script Engine
Project-level controls for the in-project Script Engine.
| Property / control | Description |
|---|---|
| Engine status | Current state (e.g. Running, Stopped). |
| Script | Path or name of the loaded script. |
| Execution time | Time spent in the script's render-frame callback. A rising value means each frame is doing more work in script. |
| Error message | Last script error, in red. Blank when the script is healthy. |
| Reload / Edit / Start / Stop buttons | Reload the script from disk, open the script file for editing, or start / stop execution. |
Autostart
Controls what happens on application / project launch. Recommended for production so a Runtime restart returns the system to a fully running state without operator intervention. The two checkboxes are independent so that, for example, a Desktop operator console can autostart inputs without also starting the streaming targets.
| Property / control | Description |
|---|---|
| Autostart inputs | Start all inputs automatically on launch. |
| Autostart targets | Start all targets automatically on launch. |
Scene view overlay
Composer supports saving a reference image of a scene that overlays in the preview pane — useful for verifying physical-set alignment, lighting consistency between sessions, or any visual A/B comparison.
| Property / control | Description |
|---|---|
| Show project reference image | Checkbox that toggles the overlay on or off. Disabled until a reference image has been saved (the project has no associated image filename yet). |
| Save reference image button | Captures the currently active scene to disk and associates the image with the project. Re-click after switching scenes to capture a new reference. |
Note
Starting in R2 2025, the reference image is captured from the currently active scene (older versions captured a fixed scene index). Re-capture the reference if you switch scenes.
Render tuning
Render Tuning automatically disables rendering for inputs that aren't currently used by any active scene, freeing CPU / GPU cycles. In a project with many inputs but only a few in use at a time, this is the single biggest free performance gain you can flip on. Inactive inputs render dimmed in the Inputs list so you can see at a glance which ones the optimiser has paused.
| Property / control | Description |
|---|---|
| Use renderer optimized for production | Enables Render Tuning for the current project. |
Note: Render Tuning is incompatible with Live Preview — enabling one disables the other.
Hide not rendered
With Render Tuning on, a Hide not rendered checkbox appears above the Inputs list on the left side of Composer Desktop:

Tick it to hide every input that Render Tuning has currently paused — anything with Do not render input switched on — so the list only shows the inputs that are actively rendering. Untick it to bring the hidden entries back.
The checkbox is a list-filter only — it doesn't start or stop any input, it just declutters the view. It's hidden when Render Tuning is off, because there's nothing to filter in that mode. Composer Desktop only — the headless Composer Runtime has no input list to filter.
For the full mechanics — how the per-frame "used inputs" walk works, the per-input Do not render input override, and the <UseOptimizedRenderer> setting in the project file — see Render Tuning in the Operations & Tuning manual.
For comprehensive performance tuning beyond these per-project options — hardware sizing, BIOS / OS tuning, encoder choice — see the Operations & Tuning manual.