

Analysis tools
Composer Desktop bundles two analyser windows for inspecting the live signal — a Video Analyzer for waveform / vectorscope / parade views of the picture, and an Audio Analyzer for FFT spectrum analysis of the audio. Both are launched from Analysis in the application menu.
Video Analyzer
The Video Analyzer examines RGB levels, luminance, saturation, colours, hue, and brightness distribution through three combined views: a parade waveform, a luminance histogram, and a vectorscope. A waveform (parade view) plots signal amplitude against horizontal position; a histogram counts how many pixels fall at each brightness level; a vectorscope plots chrominance to reveal colour saturation and hue. The skin-tone line on the vectorscope helps verify accurate skin-tone reproduction — colours that fall along the line are within the typical human-skin-tone range.
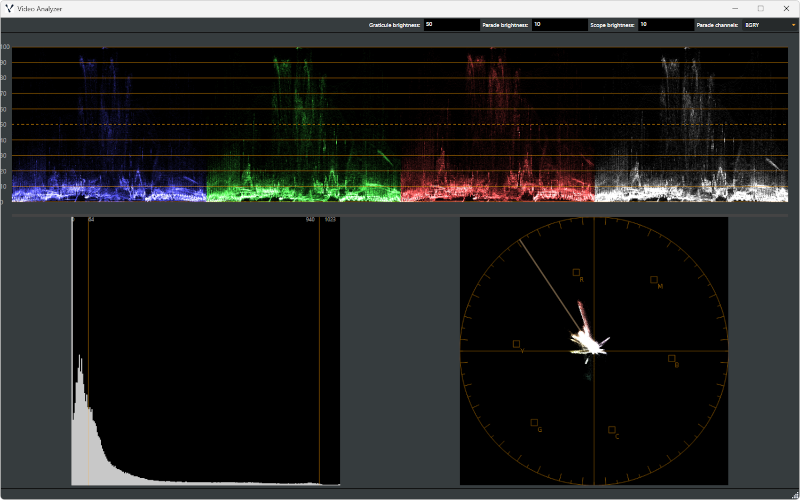
The window is split into three panels: the parade fills the upper section; the luminance histogram and vectorscope sit side by side below. A draggable splitter lets you resize the upper and lower sections. Adjustable controls:
| Control | Effect |
|---|---|
Graticule brightness |
Opacity of the parade's reference grid (the orange horizontal lines and percentage labels). |
Parade brightness |
Brightness of the parade waveform trace. |
Scope brightness |
Brightness of the vectorscope signal trace. |
Parade channels |
BGR (blue, green, red) or BGRY — adds a luminance column as a fourth channel. |
Parade
The parade shows each colour channel as a separate column. Within a column, horizontal position corresponds to horizontal position in the source image and vertical position represents pixel intensity from 0 (black, at the bottom) to 100 (peak, at the top). Orange horizontal guides mark every 10 % step, with a dashed line at 50 %.
Luminance histogram
The histogram shows the distribution of brightness in the picture, calculated as Rec. 709 luma. The horizontal axis runs from black on the left to peak white on the right; the vertical axis is the number of pixels at that brightness, auto-scaled so the tallest bar fills the panel. Four orange vertical markers sit at the standard broadcast levels (labelled in 10-bit values):
| Marker | Value | Meaning |
|---|---|---|
| Dashed | 0 |
Absolute black. |
| Solid | 64 |
Legal black (broadcast lower limit). |
| Solid | 940 |
Legal white (broadcast upper limit). |
| Dashed | 1023 |
Super-white (absolute peak). |
Content that piles up against the left edge is being crushed to black; content piling up against the right edge is being clipped to white. Content extending past the 64 or 940 markers falls outside the broadcast-legal range.
Vectorscope
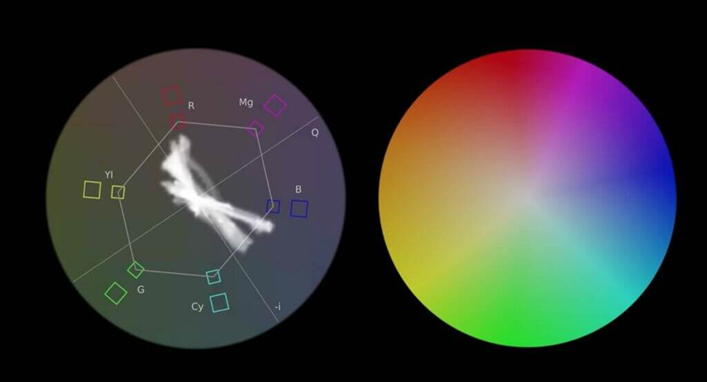
The vectorscope's colour-vector reference shows where each primary and secondary colour appears on the wheel:
Note
The Video Analyzer relies on the scene's preview being active. If video preview is disabled, the analyser examines a black frame instead of the actual content.
Audio Analyzer
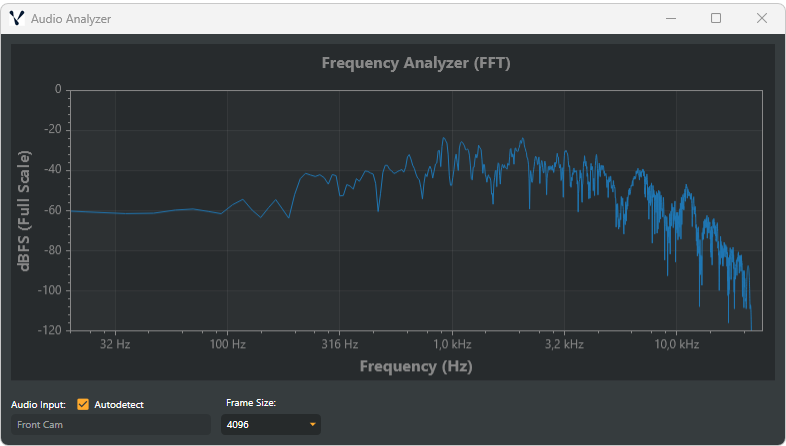
The Audio Analyzer is a real-time FFT spectrum analyser comparable to the metering you'd find in a professional digital audio workstation. It applies a Hann window, computes the FFT, and displays magnitude in dBFS across a logarithmic frequency axis from 20 Hz to 24 kHz with 50 % frame overlap. Available on Composer Desktop only; access via Analysis → Open Audio Analyser Window.
When to use it
- Monitor frequency content in real time.
- Identify problem frequencies — resonances, hum, unwanted noise.
- Verify audio quality — clipping, missing bandwidth, filter cuts.
- Compare audio sources by switching between inputs.
- Calibrate levels using the dBFS readout.
Controls
Audio input. When Autodetect is on (default), the analyser follows whichever audio strip is selected in the audio mixer. Disable autodetect to pin the analyser to a specific input.
Frame size. The number of samples used for each FFT calculation. Larger values give finer frequency resolution but slower temporal response.
| Frame size | Best for |
|---|---|
512 |
Fast transients, drums, percussive material |
1024 |
General purpose with fast response |
2048 |
Balanced detail and response |
4096 |
Standard analysis (default) |
8192 |
High frequency detail |
16384 |
Maximum detail, slow-changing signals |
Display
Frequency axis (X) — logarithmic from 20 Hz to 24 kHz (the Nyquist frequency at the project's 48 kHz sample rate). Logarithmic spacing matches human pitch perception; each octave gets equal visual space. Labels render as Hz below 1 kHz and as kHz above.
Amplitude axis (Y) — dBFS from -120 dBFS (near noise floor) up to 0 dBFS (digital ceiling). Reference points:
| Level | Meaning |
|---|---|
0 dBFS |
Maximum digital level — clipping threshold. |
-6 dBFS |
Typical peak target with headroom. |
-18 to -20 dBFS |
Common reference level. |
-60 dBFS |
Quiet signals, room tone. |
-120 dBFS |
Near the noise floor. |
Hover information — moving the mouse over the plot shows the frequency and amplitude values in the window title bar:

For example: Audio Analyzer - Frequency: 1.0 kHz, Gain: -12.3 dBFS.
Usage examples
| Scenario | Suggested frame size | What to look for |
|---|---|---|
| General monitoring | 4096 |
Good balance between detail and responsiveness. |
| Speech analysis | 2048 or 4096 |
Speech fundamentals at 85–255 Hz (male) or 165–255 Hz (female); presence at 2–4 kHz for clarity and intelligibility. |
| Background music | 4096 or 8192 |
Frequency conflicts with speech in the 100 Hz – 4 kHz band; verify low-end content doesn't overwhelm. |
| Balancing speech vs. music | 4096 |
Look for overlap in the 200 Hz – 3 kHz range where speech clarity sits. Background music should be lower in those frequencies to avoid masking. |
| Finding problem frequencies | 8192 or 16384 |
High resolution helps pinpoint exact frequencies of hum, resonance, or interference. |
Tips
- Start with the default frame size (
4096) for most situations. - Use larger frame sizes (
8192+) for bass-heavy or stable signals. - Use smaller frame sizes (
512/1024) for fast transients. - Compare different inputs by switching audio sources in the dropdown.
- Pause playback to freeze the display and examine specific moments.
- Hover anywhere on the display for exact frequency / level readout.
For per-strip metering inside the audio mixer, see Channel strip inspector; for the audio chain itself, see Audio processing workflow.