

Metrics
The Metrics tab wires Composer up to two telemetry-aggregation tools: Prometheus for time-series metrics scraped over HTTP, and Loki for log aggregation pushed over HTTP. Both are individually optional. Every setting on this tab is marked (*) in the UI and may require a Composer restart to take effect. These settings drive the Composer Monitor feature set; from R2 2026 it is part of the base Composer licence, whereas releases before R2 2026 required the separately-sold Extended Monitoring license.
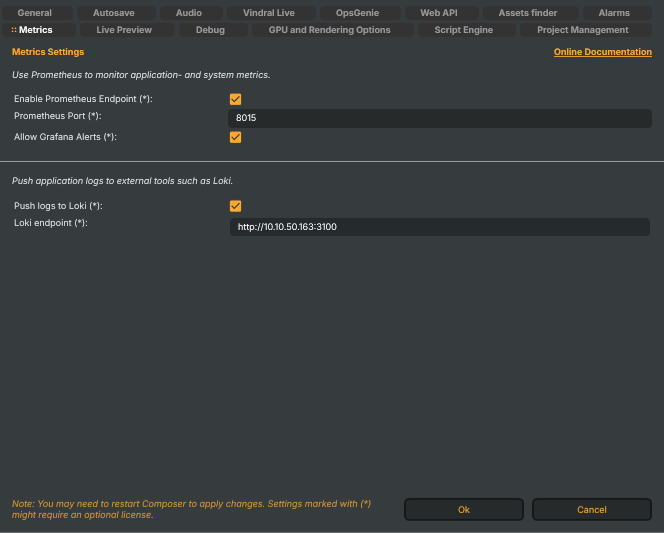
Use Prometheus to monitor application- and system metrics.
Push application logs to external tools such as Loki.
Composer Monitor ships pre-built Grafana dashboards over both data sources; to use it, follow the Composer Monitor manual end-to-end rather than configuring these endpoints individually. If you just want to scrape metrics into your own self-hosted Prometheus, the Prometheus side of this tab works on its own.
Prometheus
When enabled, Composer exposes a /metrics endpoint over HTTP that a Prometheus server can scrape on a regular cadence. The full metric set — the base metrics plus ~25 extended metrics (RTMP target stats, processing usage, alarms, GPU detail, WebSocket throughput) — is emitted from R2 2026 on every build and licence tier; before R2 2026 the extended metrics required the Extended Monitoring license. See the Composer Monitor manual for the full catalogue.
- Enable Prometheus Endpoint (*) (
EnablePrometheus) — master switch for the Prometheus listener. When off, the/metricsendpoint is unreachable. Default: on. - Prometheus Port (*) (
PrometheusPort) — TCP port the Prometheus listener uses. Default: 8015. Configure your Prometheusscrape_configto hithttp://<host>:8015/metrics. - Allow Grafana Alerts (*) (
AllowGrafanaAlerts) — when on, Composer accepts inbound webhook calls from Grafana's alerting system. Useful when the same Grafana that scrapes Composer should push alert acknowledgements back, e.g. to drive a UI banner on the Desktop. Default: off.
Loki
When enabled, every log entry Composer writes is also pushed to a Loki endpoint as it's emitted. Loki indexes the entries for centralised search and dashboarding via Grafana — the same Grafana you'd use for Prometheus, just pulling from a different data source.
- Push logs to Loki (*) (
EnablePushLogsToLoki) — master switch. Off by default, and you should keep it off until the endpoint is verified — an unreachable Loki endpoint can stall Composer shutdown by ~35 seconds while the logger drains. (See Operations & Tuning → Loki shutdown stall if you hit this.) - Loki endpoint (*) (
LokiEndPointAddress) — HTTP URL of the Loki instance, e.g.http://loki.internal:3100or the Composer Monitor stack's bundled Loki. Default:http://localhost:3100(assumes the Loki container is co-located with Composer).