

Script Debug Window
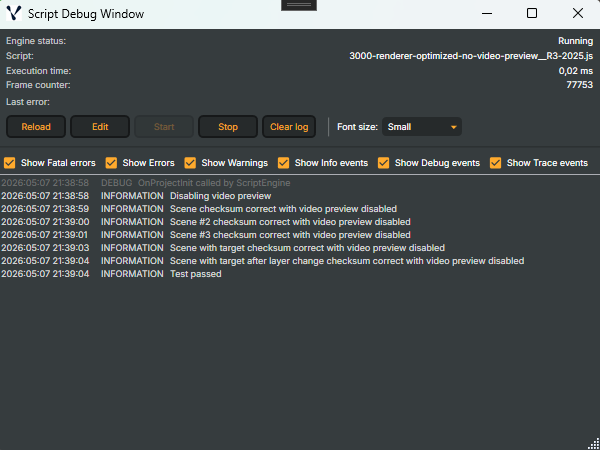
Composer Desktop ships a dedicated Script Debug Window for iterating on scripts without leaving the application — a compact, always-on-top floating panel that surfaces the script engine's live state and recent log activity in one view. Open it from the application menu: Script Engine → Open Script Debug Window….
What the window shows
The window is split into three regions, top to bottom:
1. Engine status panel. Live readouts for the running script:
- Engine status — current
ScriptEngineStatus(Disabled/Running/Updated/Error/Stopped/NotInitialized). - Script — the script file currently loaded by the project.
- Execution time — how long the most recent
OnRenderFrameinvocation took. A useful budget gauge — anything close to the per-invocation timeout will eventually trip the script-engine timeout error described in Errors and debugging. - Frame counter — how many frames the script has seen since it last started. Increments only while
Running. - Last error — when the engine is in the
Errorstate, the error message renders in red. Otherwise hidden.
A row of one-click buttons sits below the readouts:
- Reload — equivalent to
ReloadScriptCommand(re-reads the script file and restarts the engine). - Edit — opens the script in the in-Desktop script editor.
- Start / Stop — drives the engine's lifecycle directly without going through the application menu.
- Clear log — wipes the Script-Engine log buffer and the visible list (does NOT clear the Composer system log).
- Font size — Small (default) / Medium / Large dropdown for the log list, useful when projecting on a producer screen.
Filtering log severity
Six checkboxes drive what's visible in the log list:
| Filter | Severity |
|---|---|
| Show Fatal errors | Fatal |
| Show Errors | Error |
| Show Warnings | Warning |
| Show Info events | Information |
| Show Debug events | Debug |
| Show Trace events | Verbose |
Log list
Right-click any entry (or a multi-select) to Copy the rendered text to the clipboard — handy for pasting into a bug report or an issue ticket.
When to use it vs the main log window
- Script Debug Window — script-engine output only. Use while iterating on a script to see your own
Logger.Info/Logger.Errorcalls and engine timing in real time. - Log window (in the Operations manual) — every Composer subsystem (capture, decoders, network, render). Use when an issue might span the script and something else (an input that disconnected, a target that throttled).
The Script Debug Window only displays log entries written through the Script Engine logger — not output from inputs, targets, operators, or the runtime itself. For those, the main Log window is the right tool.