

Analysis tools
Composer Desktop bundles two analyser windows for inspecting the live signal — a Video Analyzer for waveform, parade, histogram and vectorscope views of the picture, and an Audio Analyzer for FFT spectrum analysis of the audio. Both are launched from Analysis in the application menu.
Video Analyzer
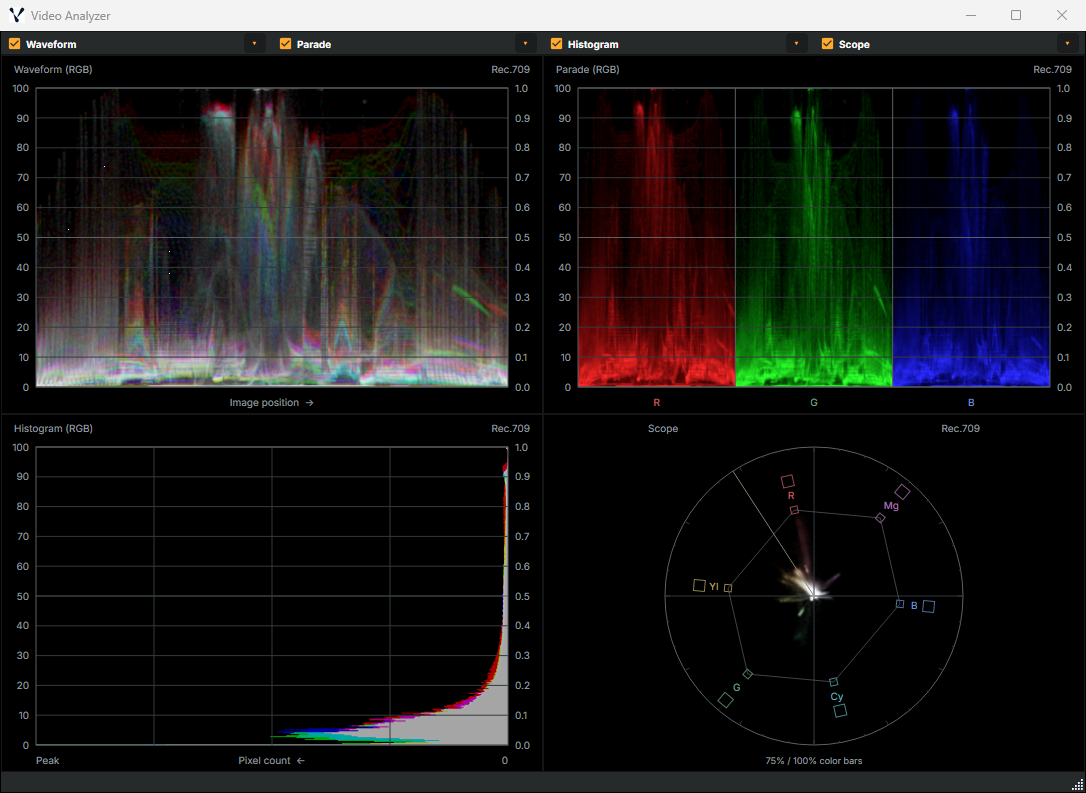
The Video Analyzer measures the picture in the preview while the project runs. It has four views, and you can show any combination of them:
- Waveform: the brightness of the red, green and blue channels, or luminance, plotted across the width of the image.
- Parade: the same measurement with red, green and blue in separate columns.
- Histogram: how many pixels sit at each brightness level, per channel.
- Scope: a vectorscope, which shows the hue and saturation of the colours in the picture.
Open it from Analysis → Open video analyzer window…. All four views measure the same frame.
What it analyses
The analyzer follows the preview. It measures the active scene, or the input selected for preview when you preview an input on its own. Switch scenes or preview another input and it follows. When a Region of Interest is drawn on the scene, it measures only the area inside that region.
All measurements use the Rec.709 colour space, which is shown in the top-right corner of each view.
Choosing views
The bar across the top of the window has a checkbox for each view. Tick or clear them to choose what is shown, and the window rearranges the views to fill the space:
| Views shown | Layout |
|---|---|
| One | Fills the window. |
| Two | Side by side. |
| Three | Two on top, and the third across the full width below. |
| Four | A two-by-two grid. |
Use Show all or Show none after the checkboxes to turn all four views on or off together.
The window can be resized freely, and the views scale with it. The scope stays round and centred in its area. A view that is turned off takes no processing time.
View settings
Each view has a ▾ button next to its checkbox, which opens that view's settings:
| Setting | Effect |
|---|---|
| Color space: Rec.709 | Shows the colour space the view measures in. It is information only. |
| RGB / Luminance | Waveform only. Chooses between separate red, green and blue traces and a single Rec.709 luminance trace. |
| Labels | Shows or hides the view's text: its title, the level numbers and the colour target names. |
| Guides | Shows or hides the grid lines and reference markings. |
| Skin-tone line | Scope only. Shows or hides the skin-tone reference line. |
The window opens with all four views, labels, guides and the skin-tone line on. The waveform defaults to RGB.
Intensity and refresh
Intensity changes the brightness of the traces in all four views. Its range is 0 to 100, with 50 as the default. Labels and guides keep their brightness.
Refresh, after the intensity slider, chooses how often the analyzer measures the preview: Every frame (the default), Every 5 frames, Every 10 frames, Every 15 frames or Every 20 frames. A longer interval reduces processing work and keeps the last traces visible between updates. Changing the interval starts with an update on the next preview frame.
Processing time
The bottom of the window reports totals for analyzer updates completed in the last elapsed second, including the gaps between updates:
| Readout | Meaning |
|---|---|
| GPU ms/s | Milliseconds spent analysing the picture and painting traces during that second. |
| CPU + wait ms/s | Elapsed milliseconds spent submitting the analysis and presenting the images, including waits for the GPU. |
| updates/s | Number of completed analyzer updates in that second. |
Choosing a longer refresh interval reduces the number of updates and should reduce the accumulated processing time. After a second with no updates, all three values fall to zero.
These figures describe the analyzer's work, rather than the whole computer's utilization. CPU + wait can overlap GPU time, so adding the two does not give a total cost. Time queued for the user interface and final window compositing are excluded.
The Documentation link beside the readout opens this page.
Waveform
The waveform plots every pixel in the picture by its position across the image (left to right) and its level (bottom to top). Red, green and blue are drawn over one another in their own colours, so where all three agree the trace is white or grey, and a coloured trace shows which channel stands out.
Choose Luminance in the waveform's ▾ menu for a single white trace of Rec.709 luminance.
The level scale runs from 0 (black) at the bottom to 100 (full white) at the top. The same scale appears on the right as 0.0 to 1.0. Guides mark every 10 %, with brighter lines at 0, 50 and 100.
A trace pressed flat against 0 means detail is being crushed into black, and one pressed flat against 100 means highlights are clipping.
Parade
The parade uses the same level scale as the waveform, but draws the red, green and blue channels side by side in three columns labelled R, G and B. Each column spans the full width of the image.
This makes it easier to compare channels. On something that should be neutral, such as a grey card, a white wall or a black background, the three columns should reach the same height. If one column sits higher, the picture has a colour cast towards that channel.
Histogram
The histogram shows how many pixels sit at each level. It shares the waveform's vertical level scale, from 0 at the bottom to 100 at the top, so a band in the histogram lines up with the same level in the waveform beside it. Pixel count runs from 0 at the right edge to Peak at the left edge, where Peak is the most populated level in the current frame. Each channel is drawn in its own colour.
A tall spike against the top or bottom of the scale means many pixels are clipped to full white or crushed to black. A picture that uses only a narrow band of the scale is low in contrast.
Scope
The scope shows colour without brightness. Every pixel is placed by its hue, which sets the angle around the circle, and its saturation, which sets the distance from the centre. Neutral pixels (black, white and every grey) land in the centre, and stronger colours reach further out. A small cross marks the centre.
Six colour targets, labelled R, Mg, B, Cy, G and Yl, mark where standard colour bars land:
- The inner, smaller target of each pair is the 75 % colour bars position. The hexagon joins these targets.
- The outer, larger target is the 100 % colour bars position.
The label below the circle, 75% / 100% color bars, is a reminder of which is which.
Reading the scope:
- A trace that leans away from the centre on a shot that should be neutral shows a colour cast, in the direction of the colour it leans towards.
- Colour bars from a correctly set-up signal land on their targets.
- Colour reaching past the 100 % targets is more saturated than colour bars, and may be outside what a broadcast chain accepts.
The skin-tone line runs from the centre towards the upper left, between red and yellow. Skin tones of every complexion tend to fall close to this line, so a face that lands well off it usually points to a colour balance problem. It is a visual reference only. It does not test whether a colour is a skin tone.
Audio Analyzer
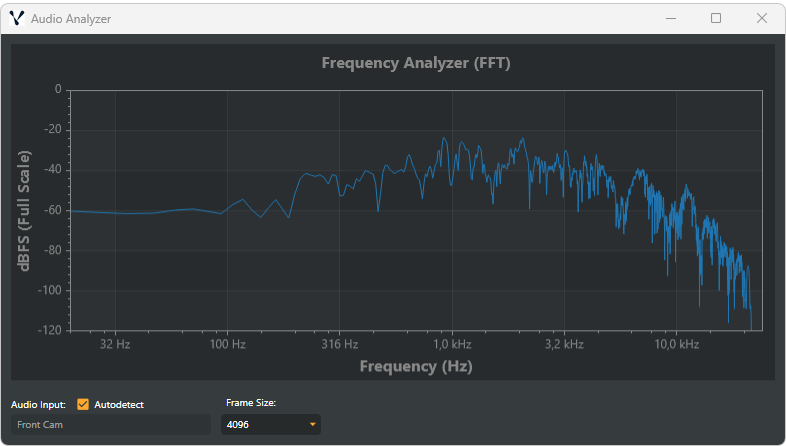
The Audio Analyzer is a real-time FFT spectrum analyser comparable to the metering you'd find in a professional digital audio workstation. It applies a Hann window, computes the FFT, and displays magnitude in dBFS across a logarithmic frequency axis from 20 Hz to 24 kHz with 50 % frame overlap. Available on Composer Desktop only; access via Analysis → Open Audio Analyser Window.
When to use it
- Monitor frequency content in real time.
- Identify problem frequencies — resonances, hum, unwanted noise.
- Verify audio quality — clipping, missing bandwidth, filter cuts.
- Compare audio sources by switching between inputs.
- Calibrate levels using the dBFS readout.
Controls
Audio input. When Autodetect is on (default), the analyser follows whichever audio strip is selected in the audio mixer. Disable autodetect to pin the analyser to a specific input.
Frame size. The number of samples used for each FFT calculation. Larger values give finer frequency resolution but slower temporal response.
| Frame size | Best for |
|---|---|
512 |
Fast transients, drums, percussive material |
1024 |
General purpose with fast response |
2048 |
Balanced detail and response |
4096 |
Standard analysis (default) |
8192 |
High frequency detail |
16384 |
Maximum detail, slow-changing signals |
Display
Frequency axis (X) — logarithmic from 20 Hz to 24 kHz (the Nyquist frequency at the project's 48 kHz sample rate). Logarithmic spacing matches human pitch perception; each octave gets equal visual space. Labels render as Hz below 1 kHz and as kHz above.
Amplitude axis (Y) — dBFS from -120 dBFS (near noise floor) up to 0 dBFS (digital ceiling). Reference points:
| Level | Meaning |
|---|---|
0 dBFS |
Maximum digital level — clipping threshold. |
-6 dBFS |
Typical peak target with headroom. |
-18 to -20 dBFS |
Common reference level. |
-60 dBFS |
Quiet signals, room tone. |
-120 dBFS |
Near the noise floor. |
Hover information — moving the mouse over the plot shows the frequency and amplitude values in the window title bar:

For example: Audio Analyzer - Frequency: 1.0 kHz, Gain: -12.3 dBFS.
Usage examples
| Scenario | Suggested frame size | What to look for |
|---|---|---|
| General monitoring | 4096 |
Good balance between detail and responsiveness. |
| Speech analysis | 2048 or 4096 |
Speech fundamentals at 85–255 Hz (male) or 165–255 Hz (female); presence at 2–4 kHz for clarity and intelligibility. |
| Background music | 4096 or 8192 |
Frequency conflicts with speech in the 100 Hz – 4 kHz band; verify low-end content doesn't overwhelm. |
| Balancing speech vs. music | 4096 |
Look for overlap in the 200 Hz – 3 kHz range where speech clarity sits. Background music should be lower in those frequencies to avoid masking. |
| Finding problem frequencies | 8192 or 16384 |
High resolution helps pinpoint exact frequencies of hum, resonance, or interference. |
Tips
- Start with the default frame size (
4096) for most situations. - Use larger frame sizes (
8192+) for bass-heavy or stable signals. - Use smaller frame sizes (
512/1024) for fast transients. - Compare different inputs by switching audio sources in the dropdown.
- Pause playback to freeze the display and examine specific moments.
- Hover anywhere on the display for exact frequency / level readout.
For per-strip metering inside the audio mixer, see Channel strip inspector; for the audio chain itself, see Audio processing workflow.