

Configuration
Composer must be configured to include labels in log entries and metrics - to allow centralized filtering and searching. Composer must also be configured to send log entries to the Composer monitor's log entry collection endpoint.
Please follow the necessary steps below, described separately for Composer Desktop and Composer Runtime.
Composer Desktop (Windows)
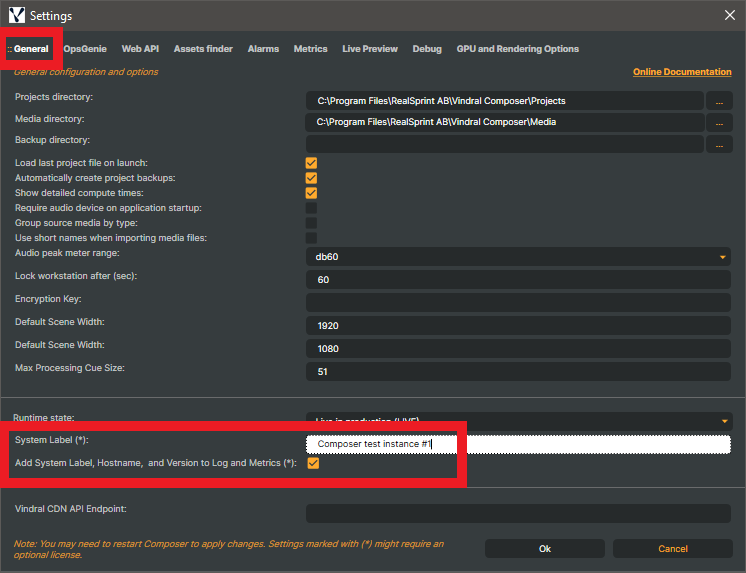
- Go to Edit -> Settings in the main menu and select the General tab
- Set a unique
System Labelfor Composer. (Such asComposer test Instance #1in the example below). - Check the
Add System Label, Hostname, and Version to Log and Metricscheckbox.
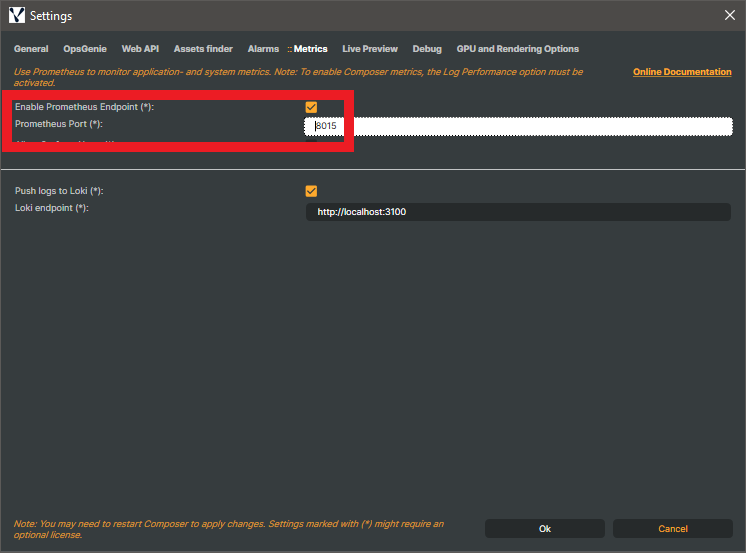
- Go to the Metrics tab
- Check the
Enable Prometheus Endpointcheckbox.
Note
The default Prometheus port is 8015. If you use a different port, make sure this is set in composerInstances.yml as well.
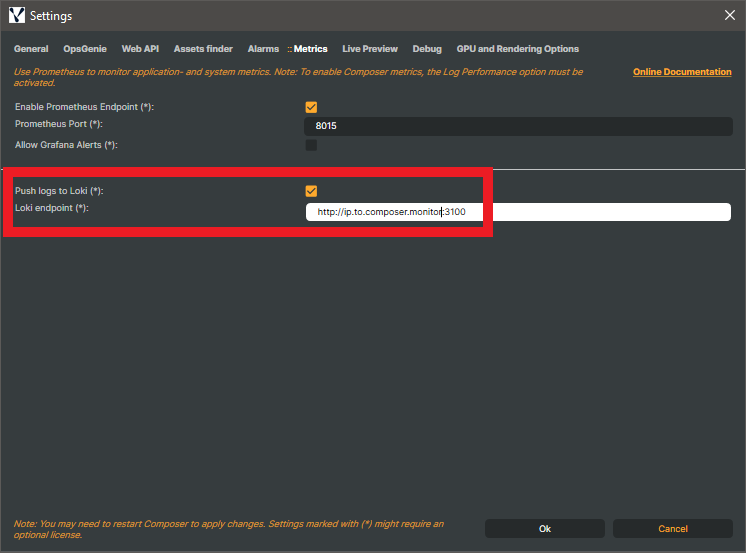
- Check the
Push logs to Lokicheckbox. - Change the
Loki endpointto the IP where Composer monitor is / will be hosted.
Note
The Composer monitor host must have port 3100 enabled to be able to receive logs.
Caution
Make sure to restart Composer for these settings to take effect.
Composer Runtime
For the Composer Runtime application, the following settings must be enabled/set in the settings.xml file in the Composer runtime directory:
- Set a unique
SystemLabel- this will uniquely identify this host's Composer instance - Set
EnablePrometheus: true- this will enable the Prometheus (metrics) endpoint - Set
AddSystemLabelToLogEntries: true- this will add system label to logs and metrics - Set
EnablePushLogsToLoki: true- this will send logs to Composer monitor - Change
LokiEndPointAddressto theip.to.composer.monitor:3100- this configures where to send the logs
Composer monitoring stack
Composer monitor will be set up to gather metrics from all running Composer instances.
Prerequisites
Composer Monitor runs in Docker, which requires that your system has Docker Desktop / Docker + Docker Compose installed. Please verify that your Docker setup meets the specified requirements, if already installed and configured.
Windows
- Install Docker Desktop
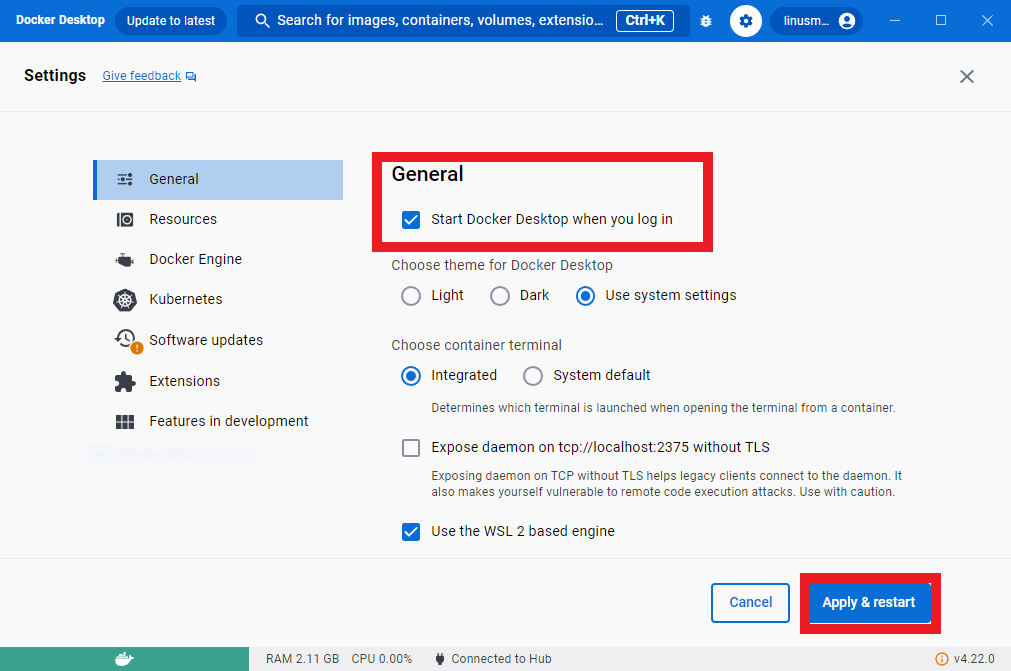
- Start the Docker Desktop application and ensure the setting to Start Docker Desktop when you log in is checked (to ensure this setup runs automatically, even after future restarts)
Linux
- Requires Docker and Docker Compose. Docker Engine 24+ is required.
Configure Composer instances
Copy the configuration file example called composerInstances.example.yml to composerInstances.yml. By default, it assumes that Composer Monitor is set up on a host that already runs a Composer instance.
To add other Composer instance targets, append the list in the following format "http://ip.to.host:<prometheus_port>,"
If you are running the optional server stats exporter (Linux only, see below) - add these as well in the following format: http://ip.to.host:9100.
Example:
- Add two new Composer instance targets
- Add one server stats (Linux only) target
- targets: [
  "http://host.docker.internal:8015",  # Gather metrics from THIS host.
  "http://20.20.50.1:8015",            # Gather metrics from 20.20.50.1.
  "http://20.20.50.2:8015",            # Gather metrics from 20.20.50.2.
  "http://20.20.50.2:9100",            # Gather server stats from 20.20.50.2
]
Note
8015 is the default Prometheus port in Composer. It is possible to use a different port - but that must be configured in Composer as well.
Optional: Include server stats (Linux only)
Start with --profile server flag.
Run it:
docker compose --profile server up -d
Stop it:
docker compose down
Run Composer Monitor
docker compose up -d
or
docker-compose up -d
The Composer Monitor Docker container should be kept running in the background.
Access Composer Monitor
While the Composer Monitor Docker container is running, the Grafana dashboards are available at http://localhost:3010 (or the IP of the current host)
The home dashboard will, after an initial startup delay, show a list of all specified Composer targets in composerInstances.yml and their connection status.
It will also show any configured server stats targets. If at least one Linux server is running the stats exporter, the Server dashboard will provide in-depth details.
Note
This view will update automatically (periodically). The example we configured above shows 3 specified Composer targets and 1 server target.
Stop Composer Monitor
If you need to stop Composer Monitor, depending on how Docker is installed, use either command below that works:
docker compose down
or
docker-compose down