

Changing the dashboards
Since Composer Monitor is delivered with provisioned dashboard configuration files. It is important to understand how to make changes and additions.
Note
Note that all dashboards are populated from their corresponding json file in the dashboards folder. Any changes made must be persisted by overwriting the contents of these files as restarting the Composer monitor system will re-populate from these files.
Composer Instances Overview is set as the default dashboard. It is read-only and populated from the dashboards/overview.json file.
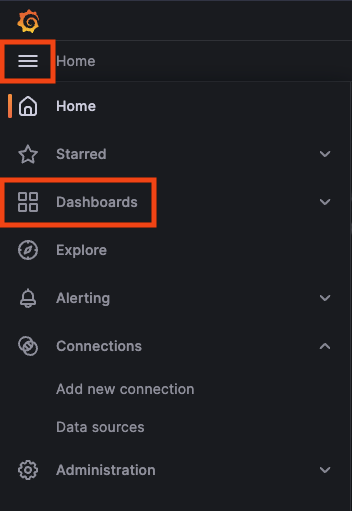
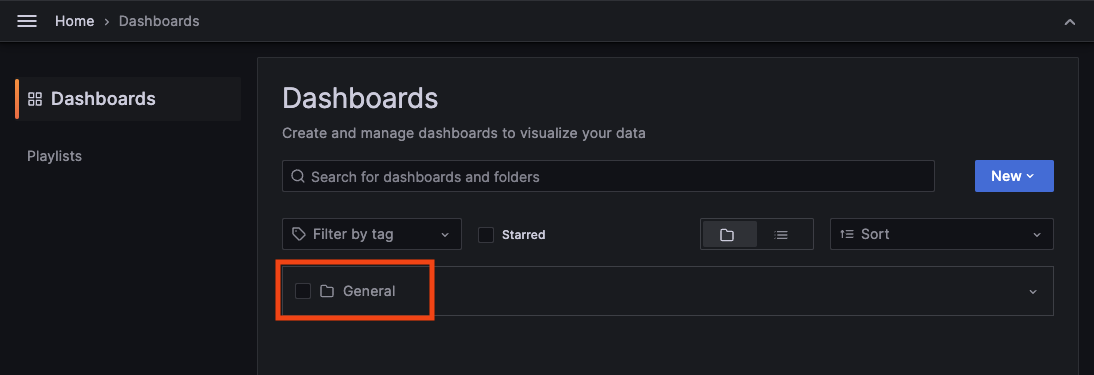
To modify (add, rearrange, delete, etc) any dashboard - go to the Dashboards section in the menu and select the General folder.
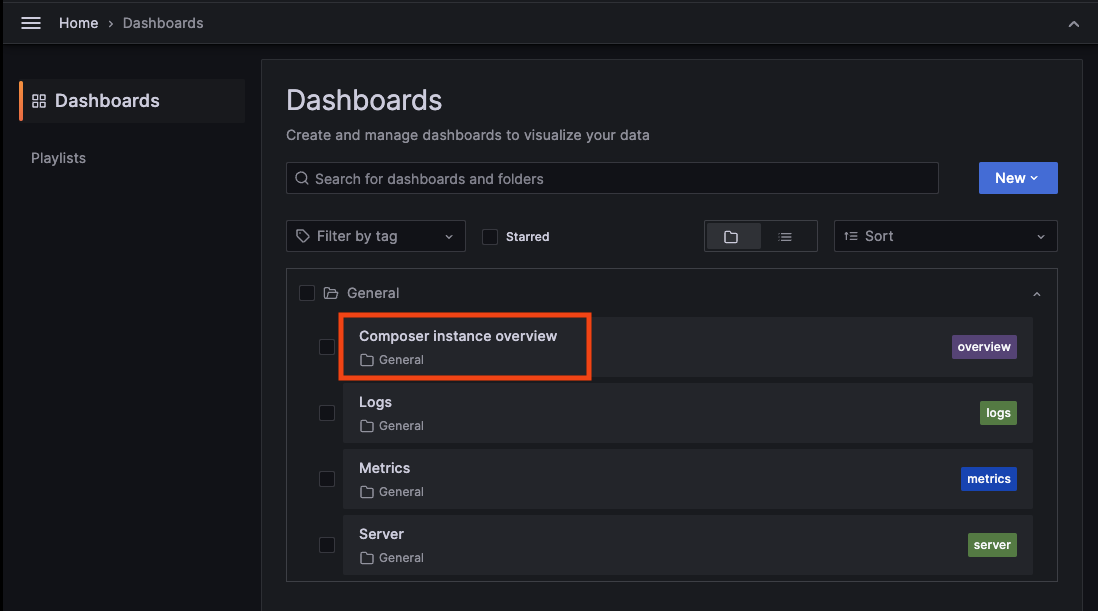
Select the dashboard to modify. For example
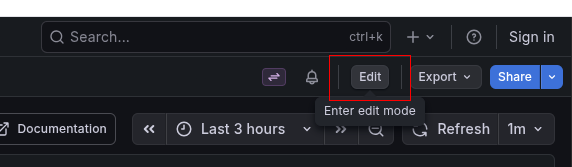
- Press Edit
- Make the changes.
- Click Save Dashboard

- Click either the
Copy to ClipboardorSave JSON to filebuttons (to paste into/overwrite the corresponding dashboard file).
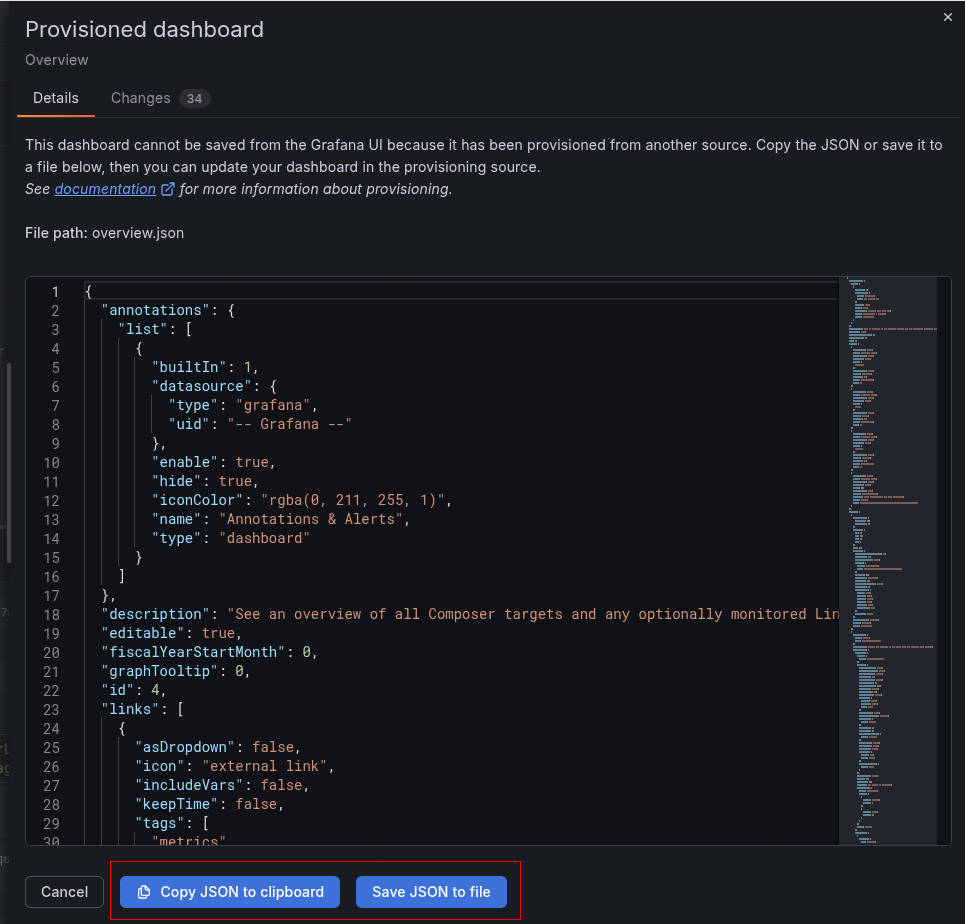
- It is now saved locally (while Composer Monitor is still running the application) and upon restart - it will read the updated configurations.
Adding new dashboards or features
If you want to add a new dashboard, create it from the menu.
Make sure to save it and export it - save the exported json file in the dashboards folder.
Any additional configuration files / dashboards you create (that are not part of the Composer Monitor archive) will not be overwritten in an update.